A signal can be broken down into its component sinusoids using the Fourier transform. When we apply the Fourier transform on a signal, we get the distribution of frequencies of the sinusoids that compose the signal. This is true for any signal. So if we treat a 2D image as a signal and apply the 2D Fourier transform to it, we will be able to identify the frequency distribution of the image.
The following are images of patterns and their Fourier transform:


square

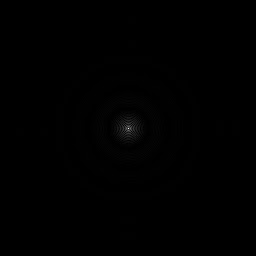


square annulus


double slit


two dots


roof
The roof pattern as well as the Fourier transform of the two dots look the same. Remember that the inverse transform is almost the same as the forward Fourier transform except for the negative sign in the exponential.
Changing the frequency of the roof pattern above,


Notice that the separation distance of the dots in the Fourier transform increases as we increase the frequency of the sinusoid producing the roof pattern. Using the 2D Fourier transform lets us determine the frequencies of patterns in an image.
If we rotate the sinusoid, the Fourier transform rotates as well,


roof pattern tilted at 15°


roof pattern tilted at 30°


roof pattern tilted at 45°


roof pattern tilted at 120°
The dots in the Fourier transform remained aligned to the direction of the sinusoid (perpendicular to the light and dark bands of the roof pattern). The 2D Fourier transform retains the information about the direction of the sinusoid as well as the frequency.
If we combine tilted sinusoids, the Fourier transform is just an addition of the Fourier transforms of the individual roof patterns,


combined roof patterns: tilted at 30° and at 135°


This verifies the idea that signals can indeed be broken down into their component sinusoids.
_________________________________________________________________________________
I'm giving myself a 10 for sheer effort.
No comments:
Post a Comment